76% of retail investor accounts lose money when trading CFD’s with eToro. 70-80% of overall global retail traders of all asset types are unprofitable.
That’s because the market has more to do with live real-time data, than historical data and trend analysis. There has not been a single real time indicator set that predicts the future. Until today.
Imagine being able to combine historical data and real time live data, & have it produce a result- that signals you to be on the lookout for a perfect trade setup, within mere seconds or minutes. Then you follow 2-3 simple steps to verify its a Go. Then place your trade & stop loss or reduce leverage countermeasure.
An indicator set that can essentially predict the future using a specific set of code, that reads historical data and actual real-time live data is something that has not been possible before with Tradingview, because of ‘repaint.’
Historical data doesn’t include records of intra-bar movements of price. This leads to a script working differently in historical data and in real-time. We can see this difference, if we add a script on a chart, wait till it compiles on a number of bars and then refresh the page. This peculiarity is called “Indicator repainting”. To solve this problem, we have made some adjustments to our code, and also added a browser extension that refreshes every 15 seconds.
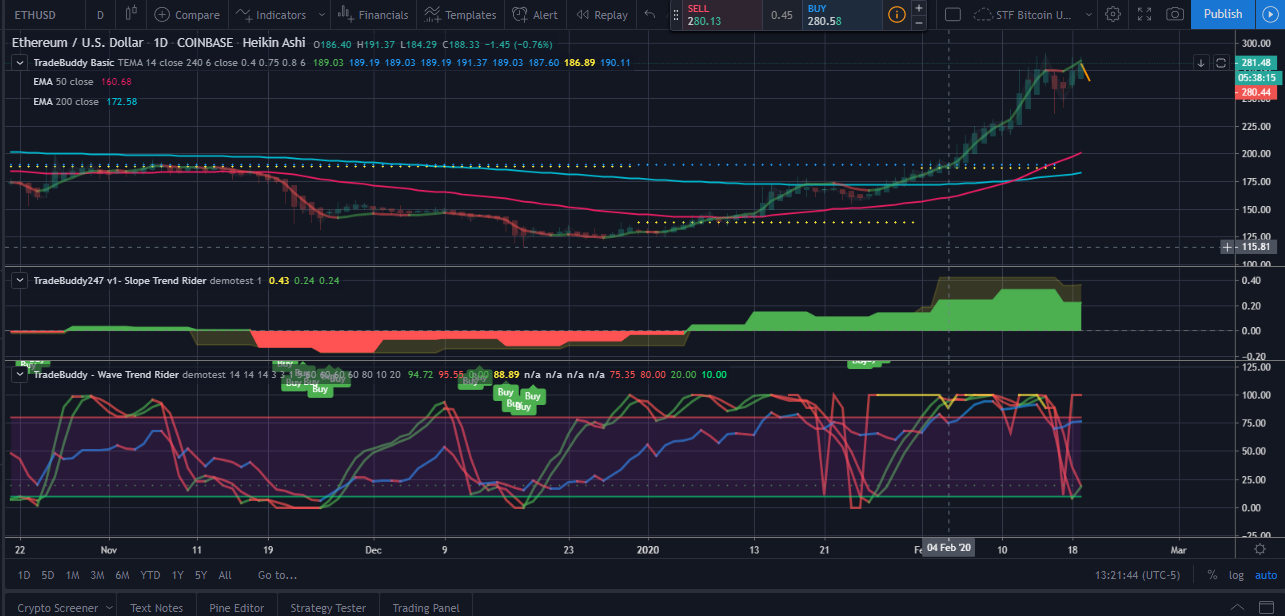
First we have the Slope Trend Rider, a proprietary tool that shows you in green, red, and yellow- the direction of price. Most of the time you will get a clear change of direction (shown as a step up or down) or change of color (from red to green and vice versa).
Generally, you could use the 1 Day chart and spend less time on the computer monitoring your trades. However, due to indicator repainting, you’ll still want to check from time to time, or set your self some price cross alerts. Very easy to do.
If the price crosses above or below a certain price, you can get a notification via email or text, and act accordingly.
Traditionally, the creator of the script and I; prefer to trade on the 1 minute time frame. You can still utilize the longer time frames for reference. So most of the time you will see the 1 min and 5 min Slope Trend Rider on my chart. I prefer both the 1 min and 5 min to be moving in the same direction, with a confirmation on the Wave Trend Rider for placing an order. I also prefer to have an overlay of Heikin Ashi candles and regular candles. The chart is very easy to set up, and with a bit of help, you can be up and running in no time. Don’t let the look of it discourage you.
I generally always have the 13 and 34 EMA’s on my chart, and I will also keep my eye on the 50 and 200 EMA for ‘Golden Crosses’. You can see a golden cross on the chart by the pink line crossing up on the blue, or the pink line crossing down on the blue. These instances signal bullish or bearish moves in the market. Often times the price will already be rising or falling, and you can get into the trade later than you would have liked to. This is where the Slope Trend Rider and Wave Trend Rider can help you. Normally I would tell you to completely ignore the EMA’s because you can absolutely trade without them, but I always like to know when a cross occurs, because I can make a quick leverage trade, and pick up a few dollars in nice profits, very quickly.
The Wave Trend Rider is a customized indicator that uses RSI, SRSI, and MFI together across multiple time frames- in order produce a combined indication of price direction. As all of the time frames line up, the greater the chances of a momentous move in the market in the indicated direction.
So, if I see the Slope Trend Rider 1 min and 5 min both step up or step up and and change from red to green, after a decline in price- then I check the Wave Trend Rider and wait until all the time frames on the indicator go from oversold and start moving up. That is where I would start my trade for LONG.
The same principles apply on shorts. When the Slope Trend Rider 1 min and 5 min both step down or step down and change from green to red, after an increase in price- then I check the Wave Trend Rider and wait until all the time frames on the indicator go from overbought and start moving down. That is where I would start my trade for a SHORT.
If I see the 1 min Slope Trend Rider step up to green, and the 5 min Slope Trend Rider step down to red, essentially they are against each other, then I would avoid the trade.
This video shows an example of live trading using the indicator. There is no audio. More videos will be available in the future for walkthrough’s for those who want to subscribe to the indicator, or go through our coaching program.
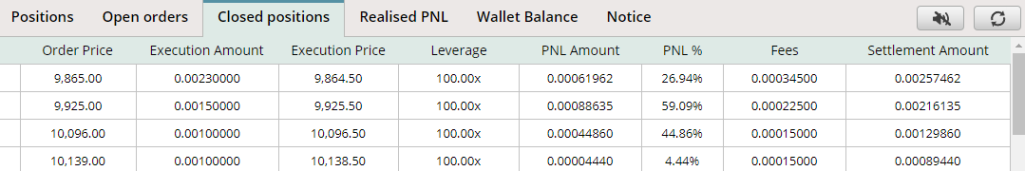
When leverage trading on Bitseven, we generally use 100x leverage. Our average take profit strategy is to sell or close a trade at 30%. This covers the 15% fee fro using 100x leverage. You can use lower leverage, but you will be in trades longer.
This indicator set works for forex, CFD’s, stocks, options. I prefer to use it for options on Robinhood and Bitseven the most.
If you are a seasoned investor, you know indicators pretty well. This will be fairly easy for you to pick up.
If you are not familiar with Tradingview or indicators, there is a learning curve; but with practice, you can have a powerful toolset and skillset mastered in just a few weeks. Within months you will feel like a seasoned investor, and grow your portfolio beyond anything you can imagine. A stock broker can help you recognize indications in the market and also help you manage your portfolio. However, they can’t predict the future, and rely heavily on historical data, classic indicators, and the news.
I know the news is a great catalyst in markets today. However, the indicator set we have; will also capture this data, and report accordingly on the chart, live.
So, let’s say you watch the news and a report of earnings for a particular stock was not good. You anticipate the stock selloff, and place an order for a short on Robinhood for 10 contracts (1000 shares), good for 1 week. All of a sudden, a ton of buyers step in and support the stock. The company does a buyback, and the price not only remains stable, but rises $10. You just lost your entire option trade.
The indicator set we have, would have signaled you that the market is moving up and not down. You would have avoided placing the short, and instead placed a long; or stayed out of the trade due to uncertainty in the indicators.
Here is an example of some recent trades.